Integration of biological molecular data into an existing drug therapy safety workflow used in hospital information systems
Lena Raupach 11 Bielefeld University, Faculty of Technology, Bioinformatics Department, Bielefeld, Germany
Abstract
In the last few decades, precision medicine became a highly weighted subject as the risk of side effects grew with the increasing drug use. The mass of evolving pharmacogenetic data invites to establish a preemptive genotyping approach and the integration of those molecular data into the workflow of an existing hospital information system to improve the safety of drug therapy. The newly introduced software module GraphSAW2-DWHBuilder creates the graph-based data warehouse. For that, molecular data from various sources is assembled in a graph database. Furthermore, an update strategy was developed to ensure that only the latest version of the data is used. To eliminate redundancies and to guarantee efficient querying, a mapper strategy was established. Another new module named GraphSAW2-Check is embedded in an existing drug therapy safety workflow used in hospitals. It contains methods for the pharmacogenetic check, which access the molecular data warehouse of the GraphSAW2-DWHBuilder and execute queries on the graph. These queries contain the drugs and the molecular data of interest and search for connections that represent toxic associations between them. If a connection is found, a warning will be issued to the medical practitioner, who can then reconsider their prescription. The results reveal the added value of molecular data integration to the drug therapy safety.
Keywords
data warehousing, pharmacogenetics, precision medicine
1 Introduction
In the last few decades, precision medicine became a highly weighted subject as the risk of side effects grew with the increasing drug use. It is estimated that 20 to 95% of the response variability, depending on the drug, comes from the individual’s genetic profile [1]. At the Vanderbilt University Medical Center, 54% of the patients received medications with an established pharmacogenomic association [2]. Taking pharmacogenetic (PGx) factors into account can help to predict treatment response for a patient with a specific genotype and estimate the risk of side effects. To increase the drug therapy safety (DTS), researchers focus on finding the causal relationship between the drug/gene pairs that dock on a molecular level and the actual causes of side effects. As pharmacogenetic research is proceeding quickly, constantly new knowledge is discovered. But since medical practitioners are occupied with taking care of patients, they should not need to use their working time to read through numerous papers every day to keep themselves up-to-date. Recent surveys showed that only 29% of the clinical professionals received education in PGx, and the rest had their training in the pre-genomic era [3]. This is one of the reasons for resistance of some clinical practitioners to consider PGx during the drug prescription. Hence, there is a need for hospital information systems (HIS) supporting biological molecular data and offering PGx decision support systems. Checking the compatibility of drugs and gene variants before the prescription and not only after an unwanted side effect occurred would enrich the scientifically-based medicine. Genotyping and sequencing methods evolve rapidly. For example, an entire human genome can be sequenced for under $1,000 [4] and preemptive PGx testing can be performed at similar costs to those of other medical examinations like the determination of the drug plasma level [5]. Because of that, the technical implementation of PGx medication checks continues to become more and more interesting in personalized medicine. Although reactive genotyping is already used in some areas of medicine, the mass of evolving PGx data invites to establish a preemptive genotyping approach. The present work addresses the integration of molecular data into the drug therapy workflow of an existing HIS to improve the DTS. For this purpose, the software module GraphSAW2 was developed, which consists of the two submodules GraphSAW2-DWHBuilder and GraphSAW2-Check. The DWHBuilder integrates molecular and PGx data from validated online databases and connects them in a graph-based data warehouse (DWH). Linking the molecular and PGx data in a graph-based DWH provides data availability, but also uniqueness of the entity nodes. For example, while PharmGKB’s relational databases use the drug name as the identifier in the annotation table [6], nodes in GraphSAW2 representing a drug are assigned different identifiers from the different data sources for the drug. Thus, these nodes can be queried by using multiple identifiers instead of only the name making queries more accurate.
The module GraphSAW2-Check is an extension of the existing medication check ID PharmaCheck® of the company ID Berlin (https://www.id-berlin.de), which is used in hospitals. It accesses the DWH and thus performs a rule-based PGx medication check in the background during the prescription process. The GraphSAW2-Check module offers the added value of being directly integrated into an existing medication check, which is already used in numerous hospitals. Since GraphSAW2 is a cooperation project with ID Berlin, the code of this project is not open source.
2 Assembly of pharmacogenetic data into a graph
The newly introduced software module GraphSAW2-DWHBuilder creates a graph-based, molecular DWH out of various data sources. Due to the graph structure, the highly connected nodes and their edges can both be queried in linear time. The modular concept of the program allows an easy extension of the data sources. Moreover, an update strategy was developed to ensure that only the latest version of the data was used. In order to eliminate redundancies and to guarantee efficient querying, a mapper strategy was also established.
The detailed strategy used for the data integration in the GraphSAW2-DWHBuilder module is shown in Figure 1 [Fig. 1]. On the left hand side, it is shown that the approach is divided into the steps extract, transform and load (ETL).
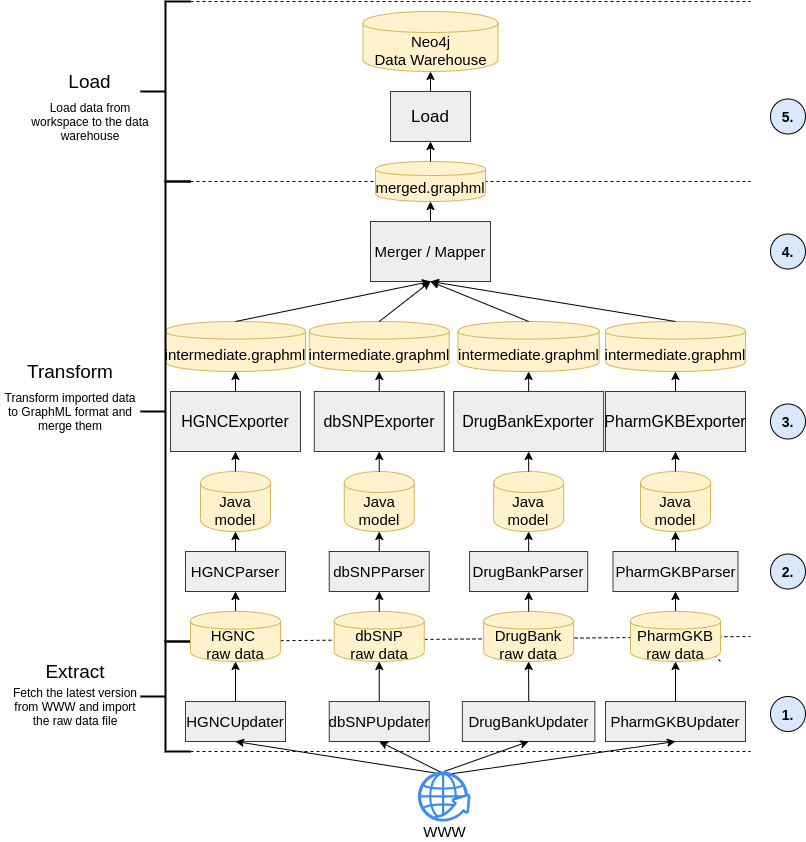
2.1 Extract
A problem of integrating molecular, pharmaceutical and PGx data is that they are constantly updated. Because of that, GraphSAW2-DWHBuilder implements an update feature that is shown at the bottom of Figure 1 [Fig. 1] in step 1. This update feature checks whether the raw data files of the data sources are still up-to-date. The metadata of the raw data files is stored in a metadata properties file. If the current version of the metadata does not match the ones that are available online, it fetches the latest versions from the online resources and downloads them into the workspace. For the molecular DWH, the data sources are PharmGKB (https://www.pharmgkb.org/), DrugBank (https://www.drugbank.ca/) and DPWG (Dutch Pharmacogenetics Working Group; https://www.knmp.nl/). PharmGKB delivers PGx annotations with a level of evidence (LOE) [7]. Only annotations with an LOE score of 1 or 2 are integrated into the DWH since these are the most reliable annotations.
2.2 Transform
In the transformation process, the multiple, raw table-based data from the sources are transformed into separate graph based data files and then joined together (see step 2, 3 and 4 of Figure 1 [Fig. 1]). In step 2, each of the raw data files is read into a Java object-relational model using parsers. The entities of the relational source databases are read in as Java classes and the attributes are read in as variables. In the third step, the exporter translates the Java object data from the model into GraphML files (named intermediate.graphml in the figure) as linked graph structures. The fourth step in Figure 1 [Fig. 1] shows the merging and mapping of the sub-graphs from the different data sources into one connected network.
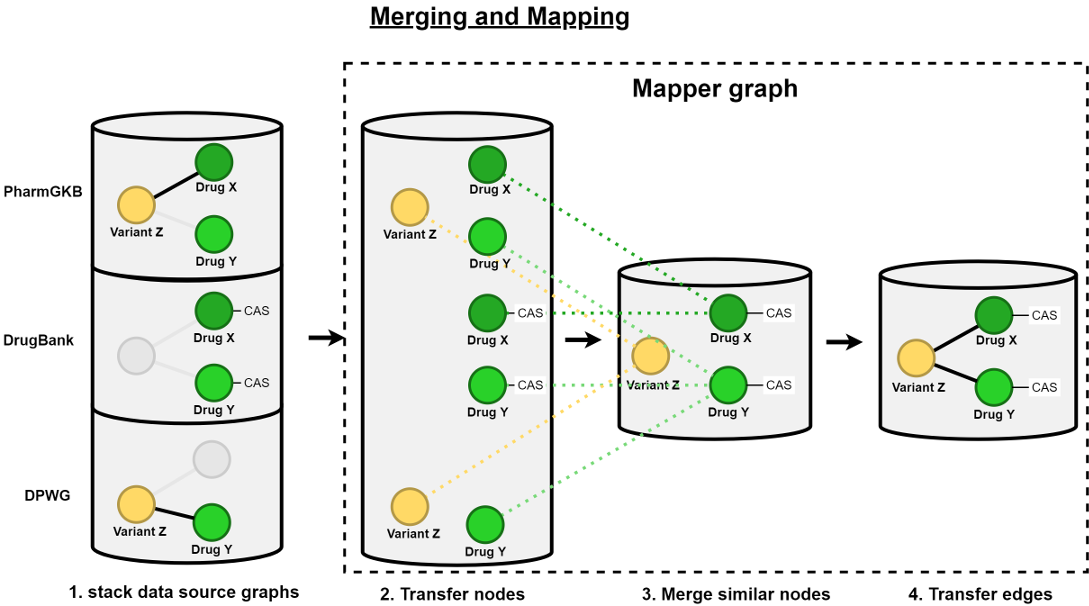
This merging and mapping step is pictured in more detail in Figure 2 [Fig. 2]. First, all intermediate GraphML files are put together into one common file (see the left stacked databases in Figure 2 [Fig. 2]). Thereafter, the mapper graph is initialized with a copy of the nodes of all sub-graphs collected together into one common, separate mapper graph. Consequently, those transferred nodes are joined together if they are provided with the same identifier and the same node label. The edges between the mapper nodes are also transferred from the data source graphs. The last step of this mapping process is linking each mapper node to its origin data source nodes.
2.3 Load
In the fifth step of the ETL process, the merged and mapped GraphML file containing the data source sub-graphs and the mapper graph is loaded into a Neo4j graph-based DWH using the Java library Neo4j Java Driver (Slim package) 4.4 API [8]. Finally, the resulting Neo4j database can be versioned and delivered to the hospital’s HIS, where it can be queried by the PGx check implemented in the DTS workflow using the query language Cypher.
3 Implementing a pharmacogenetic check into an existing drug therapy safety workflow
The GraphSAW2-Check module is embedded in the existing drug therapy safety workflow ID PharmaCheck® of the company ID Berlin as a plugin. Java libraries from an already existing DTS workflow are used. ID Berlin is the market leader for software for revenue-optimized coding and for safe medication in Germany [9]. As an extension of other already existing check DTS classes, the PGx check can be easily added since the input/output parameters are standardized. If the patient’s health record contains a set of gene variants and a drug is going to be prescribed, both sets are given to the algorithm as the input, all permutation possibilities between them are iterated and a search for toxic relationships is performed. The PGx check accesses the molecular DWH of the GraphSAW2-DWHBuilder and executes queries on the graph. These queries contain the drugs and the molecular data of interest and search for connections that represent toxic associations between them. If such a connection is found, a warning will be issued to the users who can then reconsider their prescription.
3.1 Querying the molecular graph database
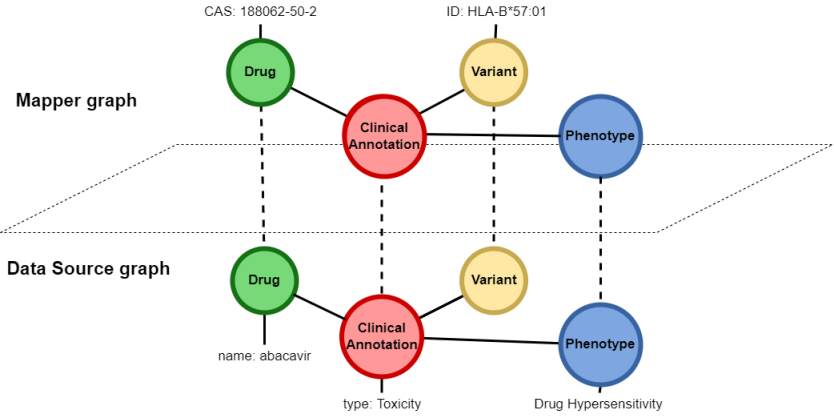
Figure 3 [Fig. 3] shows the necessary nodes for one of the various queries of the GraphSAW2-Check. The bottom part of Figure 3 [Fig. 3] shows the PharmGKB nodes that need to be queried. The Clinical Annotation node has the property type, which represents the phenotype category of this annotation. It is connected to a Drug, a Variant and a Phenotype node that have detailed information, e.g. the phenotype text or the trade name of the drug. The PharmGKB nodes are connected to other data source nodes via the mapper graph, which is shown in the upper part of Figure 3 [Fig. 3]. The mapper nodes collect all identifiers which are used in all data sources. And since PharmGKB does not provide chemical abstracts service (CAS) numbers of the drugs in their data, those CAS numbers have to be collected from the DrugBank nodes and are stored in the corresponding Drug mapper node at the top left of Figure 3.
In order to run the GraphSAW2-Check, the database server must be up and running for the database to be ready for being queried. After fetching all CAS numbers and gene variant identifiers out of the electronic health record, all combinations of drug/variant pairs are permuted for the execution of the check-specific queries. The results of these queries, for example the drugs that have a toxic relationship with the patient’s gene variants, are returned as lists of standardized result objects.
In Figure 4A [Fig. 4], a Cypher query is displayed, searching for a combination of nodes that satisfy the where conditions. In this case, the check fetches a clinical annotation with the phenotype category Toxicity, the drug abacavir (CAS: 188062-50-2) and the gene variant HLA-B*57:01.
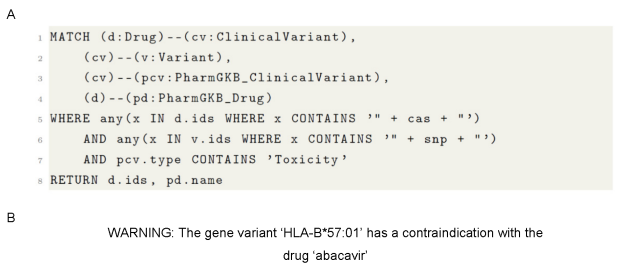
Instead of type ‘Toxic’, the clinical annotations can be of the types ‘Dosage’, ‘Metabolism’, ‘Efficacy’ and ‘Other’ as well. In each case, the warning will be of a specific category that is also displayed to the medical practitioner. The resulting feedback to the medical practitioner should be returned as a warning, as displayed in Figure 4B [Fig. 4].
4 Results
In order to be able to conclude the added value of a PGx check in a DTS workflow, an insight into the frequency of the warnings thrown is given below. According to the drug report (‘Arzneimittelreport’) [10] from the German health insurance company Barmer (https://www.barmer.de/), Figure 5 [Fig. 5] shows the top 20 prescribed drugs and their numbers of PGx clinical annotations (#PGx annotations) in PharmGKB. The drugs are placed on the x-axis of the bar chart and the y-axis shows the #PGx annotations. The bars in the diagram are layered and each layer signifies a different level of evidence for the clinical annotations.
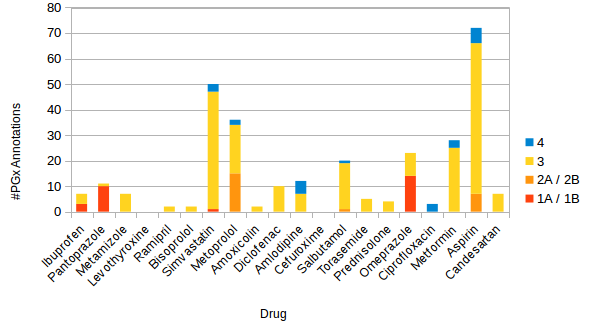
The number of annotations containing the same drug-variant pair are cumulated if they have different types of associations. In total, 301 PGx annotations were found in PharmGKB for the top 20 prescribed drugs. The distribution of annotations across the LOE looks as follows: level 1A or 1B (28), level 2A or 2B (23), level 3 (227) and level 4 (23). If only the annotations with level 1 or 2 are considered as significant, the following seven drugs (with their corresponding numbers of significant annotations) remain as significant PGx drugs: ibuprofen (3), pantoprazole (10), simvastatin (1), metoprolol (15), salbutamol (1), omeprazole (14) and aspirin (7). Altogether, there are 51 significant annotations that can be checked when prescribing one of the seven most frequently prescribed drugs.
To estimate how often a PGx check in an DTS workflow would actually trigger a warning, the frequencies of the gene variants listed in Figure 5 [Fig. 5] are listed in Table 1 [Tab. 1]. In the first column of Table 1 [Tab. 1], the seven drugs with significant annotations mentioned above are listed. The second column contains the corresponding haplotypes or gene variants and the third column reveals their corresponding frequencies. In particular, all listed frequencies except one refer to the European population since the top 20 prescribed drugs from Figure 5 [Fig. 5] correspond to prescriptions made in Germany. The frequency of the haplotype HLA-DPB1*03:01:01 was taken from a study from 2020 [11], where the population was from Saudi Arabia.
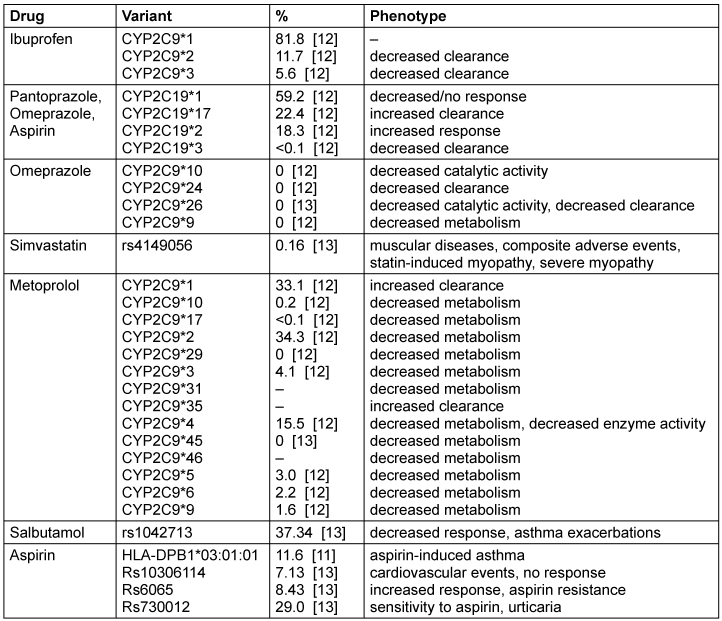
In the first row of Table 1 [Tab. 1] can be seen, for example, that the haplotype CYP2C9*1 was found in 81.8% of the European population, whereas CYP2C19*1 appeared in 59.2% and CYP2D6*1 was found in 33.1%.
According to Barmer [10], ibuprofen was prescribed for 1,674,850 patients in 2018, which makes it the most prescribed drug in this year. It has PGx annotations with the three haplotypes CYP2C9*1, *2 and *3. These are by far the most common variants of the gene. The *2 and *3 variants may cause a decreased clearance of the drug ibuprofen. Considering the fact that a total of 1,674,850 patients were treated with ibuprofen, 195,957 patients would statistically have the haplotype CYP2C9*2 and 93,792 patients would have the haplotype CYP2C9*3. Together, both would result in decreased clearance for 289,749 people, which could have been predicted by PGx checks.
5 Discussion
With the presented methods, an approach of integrating molecular data into a DTS workflow is introduced. By comparing the patient’s gene variants and a drug with a PGx knowledge base during the prescription process, the physician’s decision on the right drug and dose can be personalized on the patient’s genetic predispositions. The DWH’s data sources can be expanded easily due to the modular software architecture of the DWH builder. Since the DWH can be queried in linear time as it is graph-based, the PGx check can run in the background during the prescription process in seconds. The update strategy during the ETL process of the DWH is an important component since the PGx data is updated frequently in the data sources. A major criticism of GraphSAW2 is that the quality of the PGx software strongly depends on the accuracy and correctness of the data sources. Fortunately, scales such as the ’level of evidence’ scale of PharmGKB provide a scale for grading the annotations by representing the biological provenness. The results show that for the most prescribed drugs, a representative number of annotations can be found. Some variants occur in quite a number of annotations because of their established PGx association, so they have to most likely be genotyped on patients. After the validation by a notified body for Medical Device Regulation (MDR) compatibility, the presented methods could lead to an improved prescription process by personalizing the drug and dose depending on the genetic predispositions of the patient.
An evaluation of the PGx check with real genetic patient data would make a more solid evaluation of the added value of integrating molecular data in a DTS workflow possible. In addition, results about the clinical utility and the cost effectiveness of using GraphSAW2 on real data could be achieved. The expansion of the DWH with more PGx data, but also other molecular or pharmacological data, would offer more options for implementing various checks. There is also the option of implementing a machine learning algorithm that the system uses to learn which PGx annotations the doctors found helpful and which should no longer be displayed because they have not proven themselves in practice. Over a longer period of time, it can be evaluated which check has brought the patients the most benefit and has the best usability for medical practitioners. In addition, a strategy still needs to be developed with which genomic laboratory data can be automatically read into the electronic health record so that they do not have to be entered manually. This is the only way to ensure that all important PGx-relevant gene variants are checked during the prescription.
Notes
Competing interests
The author declares that she has no competing interests.
References
[1] Arwood MJ, Chumnumwat S, Cavallari LH, Nutescu EA, Duarte JD. Implementing Pharmacogenomics at Your Institution: Establishment and Overcoming Implementation Challenges. Clin Transl Sci. 2016 Oct;9(5):233-45. DOI: 10.1111/cts.12404[2] Schildcrout JS, Denny JC, Bowton E, Gregg W, Pulley JM, Basford MA, Cowan JD, Xu H, Ramirez AH, Crawford DC, Ritchie MD, Peterson JF, Masys DR, Wilke RA, Roden DM. Optimizing drug outcomes through pharmacogenetics: a case for preemptive genotyping. Clin Pharmacol Ther. 2012 Aug;92(2):235-42. DOI: 10.1038/clpt.2012.66
[3] Dunnenberger HM, Crews KR, Hoffman JM, Caudle KE, Broeckel U, Howard SC, Hunkler RJ, Klein TE, Evans WE, Relling MV. Preemptive clinical pharmacogenetics implementation: current programs in five US medical centers. Annu Rev Pharmacol Toxicol. 2015;55:89-106. DOI: 10.1146/annurev-pharmtox-010814-124835
[4] Johnson JA, Burkley BM, Langaee TY, Clare-Salzler MJ, Klein TE, Altman RB. Implementing personalized medicine: development of a cost-effective customized pharmacogenetics genotyping array. Clin Pharmacol Ther. 2012 Oct;92(4):437-9. DOI: 10.1038/clpt.2012.125
[5] Borobia AM, Dapia I, Tong HY, Arias P, Muñoz M, Tenorio J, Hernández R, García García I, Gordo G, Ramírez E, Frías J, Lapunzina P, Carcas AJ. Clinical Implementation of Pharmacogenetic Testing in a Hospital of the Spanish National Health System: Strategy and Experience Over 3 Years. Clin Transl Sci. 2018 Mar;11(2):189-99. DOI: 10.1111/cts.12526
[6] PharmGKB. Clinical Annotations. Level of evidence 1-2 [data file]. [last accessed 2020 Dec 06]. Available from: https://api.pharmgkb.org/v1/download/file/data/clinicalAnnotations_LOE1-2.zip
[7] PharmGKB. Clinical Annotation Levels of Evidence. [last accessed 2020 Dec 06]. Available from: https://www.pharmgkb.org/page/clinAnnLevels
[8] Neo4j Java Driver (Slim package) 4.4 API. [last accessed 2020 Dec 06]. Available from: https://neo4j.com/docs/api/java-driver/current/overview-summary.html
[9] ID Berlin. ID MEDICS. [last accessed 2022 May 31]. Available from: https://www.id-berlin.de/produkte/emedikation/id-medics/
[10] Barmer. Arzneimittelreport 2018. [last accessed 2020 Dec 02]. Available from: https://www.barmer.de/presse/infothek/studien-und-reporte/arzneimittelreporte/arzneimittelreport-2018-1065088
[11] Jawdat D, Uyar FA, Alaskar A, Müller CR, Hajeer A. HLA-A, -B, -C, -DRB1, -DQB1, and -DPB1 Allele and Haplotype Frequencies of 28,927 Saudi Stem Cell Donors Typed by Next-Generation Sequencing. Front Immunol. 2020 Oct 22;11:544768. DOI: 10.3389/fimmu.2020.544768
[12] Zhou Y, Ingelman-Sundberg M, Lauschke VM. Worldwide Distribution of Cytochrome P450 Alleles: A Meta-analysis of Population-scale Sequencing Projects. Clin Pharmacol Ther. 2017 Oct;102(4):688-700. DOI: 10.1002/cpt.690
[13] NCBI. dbSNP – Short Genetic Variations. [last accessed 2020 Dec 06]. Available from: https://www.ncbi.nlm.nih.gov/snp